
Introduction:
Technical indicators are tools used in technical analysis to help traders understand and analyze financial markets. They are used to identify trends, forecast market direction, and confirm trades. There are many different technical indicators available, each with its own specific purpose and characteristics. In this essay, we will explore several popular technical indicators, including the moving average, Bollinger Bands, relative strength index (RSI), stochastic oscillator, MACD (moving average convergence divergence), Fibonacci retracement, and pivot points. We will discuss what each indicator does, how it is used, and the benefits of using it in trading.
Technical indicators are mathematical calculations based on the price and/or volume of a security. They are used to help traders understand and analyze financial markets and make informed trading decisions. Technical indicators can be classified into several categories, including trend, momentum, volatility, and volume indicators.
Trend indicators are used to identify the direction of a trend, whether it is up, down, or sideways. Moving averages, Bollinger Bands, and Fibonacci retracement are all examples of trend indicators.
Momentum indicators are used to measure the strength of a trend. The relative strength index (RSI) and the stochastic oscillator are examples of momentum indicators.
Volatility indicators are used to measure the level of price fluctuations in a security. Bollinger Bands and the average true range (ATR) are examples of volatility indicators.
Volume indicators are used to measure the number of trades made in a security or the total amount of a security that is traded over a certain period of time. The on-balance volume (OBV) and the Chaikin money flow (CMF) are examples of volume indicators.
In this essay, we will focus on several popular technical indicators and explore how they can be used in trading.
II. Moving Average
A moving average is a technical indicator that shows the average price of a security over a specific period of time. It is calculated by adding up the closing prices of a security for a certain number of time periods and then dividing the total by the number of time periods. The result is a smoothed line that follows the price action of the security.
There are three main types of moving averages: simple, exponential, and weighted.
A simple moving average (SMA) is calculated by adding up the closing prices of a security for a certain number of time periods and then dividing the total by the number of time periods. For example, a 50-day SMA is calculated by adding up the closing prices of a security for the past 50 days and then dividing the total by 50.
An exponential moving average (EMA) gives more weight to recent prices and is therefore more responsive to recent price action. It is calculated using a formula that assigns a greater weight to the most recent prices.
A weighted moving average (WMA) gives more weight to the most recent prices, similar to the EMA. However, it assigns a constant weight to each price, rather than using a formula to calculate the weight.
To interpret a moving average, traders look for crossovers, where the moving average crosses above or below the price action of the security. A crossover above the price action is considered bullish, while a crossover below the price action is considered bearish. Moving averages can also be used to identify support and resistance levels..
The benefits of using moving averages include the ability to smooth out price action, identify trends, and identify potential areas of support and resistance. They can also be used to confirm trades and help traders set stop-loss orders.
Moving averages are commonly used with other technical indicators and chart patterns to provide a complete picture of the market. For example, traders may use moving averages in conjunction with Bollinger Bands to confirm trend direction and identify overbought and oversold conditions.
In summary, the moving average is a useful technical indicator that can help traders understand and analyze financial markets. It is important for traders to understand how to interpret moving averages and to choose the right type of moving average for their trading style and goals.
III. Bollinger Bands
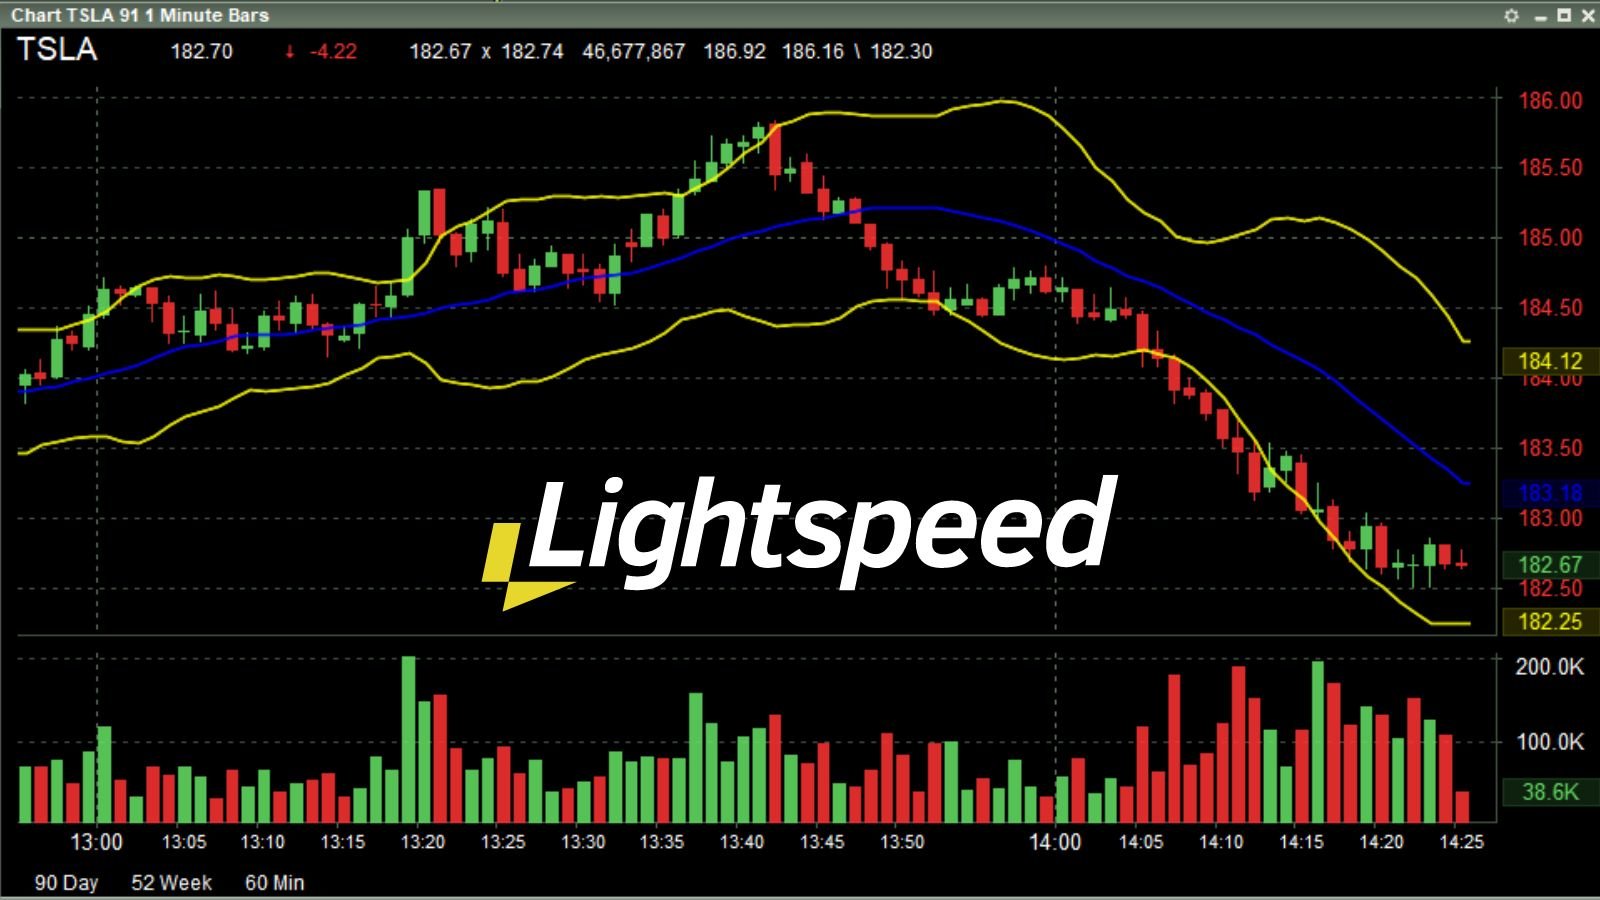
Bollinger Bands are a technical indicator that is used to measure volatility. They consist of a moving average and two standard deviation bands that are placed above and below the moving average. The moving average is typically a 20-period simple moving average, and the standard deviation bands are set to two standard deviations above and below the moving average.
To interpret Bollinger Bands, traders look for price action that touches or breaks through the upper or lower bands. When the price touches the upper band, it is considered overbought, and when it touches the lower band, it is considered oversold. A breakout above the upper band is considered bullish, while a breakout below the lower band is considered bearish.
The benefits of using Bollinger Bands include the ability to identify overbought and oversold conditions, identify trend strength, and identify potential areas of support and resistance. They can also be used to confirm trades and help traders set stop-loss orders.
IV. Relative Strength Index (RSI)
The relative strength index (RSI) is a momentum indicator that is used to measure the strength of a trend. It is calculated using a formula that compares the number of up days to the number of down days over a specific period of time.
To interpret the RSI, traders look for readings above 70, which indicate overbought conditions, and readings below 30, which indicate oversold conditions. A reading above 70 may be a sign to sell, while a reading below 30 may be a sign to buy. The RSI can also be used to identify potential trend reversals and to confirm trades.
The benefits of using the RSI include the ability to identify overbought and oversold conditions, identify potential trend reversals, and confirm trades.
V. Stochastic Oscillator
The stochastic oscillator is a momentum indicator that is used to measure the strength of a trend. It is calculated using a formula that compares the current closing price to the high and low prices over a specific period of time.
To interpret the stochastic oscillator, traders look for readings above 80, which indicate overbought conditions, and readings below 20, which indicate oversold conditions. A reading above 80 may be a sign to sell, while a reading below 20 may be a sign to buy. The stochastic oscillator can also be used to identify potential trend reversals and to confirm trades.
The benefits of using the stochastic oscillator include the ability to identify overbought and oversold conditions, identify potential trend reversals, and confirm trades.
VI. MACD (Moving Average Convergence Divergence)
The MACD (moving average convergence divergence) is a momentum indicator that is used to measure the strength of a trend. It is calculated by subtracting a 26-period exponential moving average (EMA) from a 12-period EMA. A nine-period EMA, called the "signal line," is then plotted on top of the MACD to help traders identify buy and sell signals.
To interpret the MACD, traders look for crossovers between the MACD and the signal line. A crossover above the signal line is considered bullish, while a crossover below the signal line is considered bearish. The MACD can also be used to identify divergences, where the price action of the security is moving in the opposite direction of the MACD.
The benefits of using the MACD include the ability to identify trend strength, identify potential trend reversals, and confirm trades.
VII. Fibonacci Retracement
Fibonacci retracement is a technical indicator that is used to identify potential levels of support and resistance. It is based on the idea that prices will often retrace a predictable portion of a move, after which they will continue to move in the original direction.
To calculate Fibonacci retracement levels, traders draw a trendline between two extreme points on a chart and then divide the vertical distance by the key Fibonacci ratios of 23.6%, 38.2%, 50%, 61.8%, and 100%. These levels can then be used to identify potential areas where the price may experience support or resistance.
To interpret Fibonacci retracement, traders look for price action to reach the key levels and then watch for a reaction. If the price bounces off a key level, it may be a sign of support or resistance. If the price breaks through a key level, it may be a sign of a trend reversal.
The benefits of using Fibonacci retracement include the ability to identify potential areas of support and resistance and to confirm trades.
VIII. Pivot Points
Pivot points are technical indicators that are used to identify potential levels of support and resistance. They are calculated using the high, low, and closing prices of a security over a specific period of time.
To calculate pivot points, traders use the following formulas:
• Pivot point (P) = (high + low + close) / 3
• First resistance level (R1) = (2 * P) - low
• First support level (S1) = (2 * P) - high
• Second resistance level (R2) = P + (R1 - S1)
• Second support level (S2) = P - (R1 - S1)
To interpret pivot points, traders look for price action to reach the key levels and then watch for a reaction. If the price bounces off a key level, it may be a sign of support or resistance. If the price breaks through a key level, it may be a sign of a trend reversal.
The benefits of using pivot points include the ability to identify potential areas of support and resistance and to confirm trades.
IX. Conclusion
In conclusion, technical indicators are important tools for traders to understand and analyze financial markets. There are many different technical indicators available, each with its own specific purpose and characteristics. Some of the most popular technical indicators include the moving average, Bollinger Bands, relative strength index (RSI), stochastic oscillator, MACD (moving average convergence divergence), Fibonacci retracement, and pivot points. Each of these indicators can be used to identify trends, forecast market direction, confirm trades, and identify potential areas of support and resistance. It is important for traders to understand how to use technical indicators and to choose the right indicators for their trading style and goals.
Active Trading with Lightspeed
Lightspeed provides professional traders with all the tools required to help them find success in stock trading, and we have been developing and honing our active trader platform to offer an optimal user experience. With the intuitive interface layouts and institutional quality stock and options scanners, we aim to help traders reach their goals, no matter what their strategy is. We also offer our clients some of the lowest trading fees in the industry.
For more information on a professional trading platform with Lightspeed, please call us at 1-888-577-3123, request a demo, or to open an account.
Lightspeed Financial Services Group LLC is not affiliated with these third-party market commentators/educators or service providers. Data, information, and material (“Content”) are provided for informational and educational purposes only. This content neither is, nor should be construed as an offer, solicitation, or recommendation to buy or sell any securities or contracts. Any investment decisions made by the user through the use of such content are solely based on the user's independent analysis taking into consideration your financial circumstances, investment objectives, and risk tolerance. Lightspeed Financial Services Group LLC does not endorse, offer or recommend any of the services or commentary provided by any of the market commentators/educators or service providers, and any information used to execute any trading strategies are solely based on the independent analysis of the user.
Futures trading involves the substantial risk of loss and is not suitable for all investors.
Each investor must consider whether this is a suitable investment since you may lose all of or more than your initial investment.
Past performance is not indicative of future results.
Latest posts
Never miss a beat
Stay on top of the latest news and market insights
Trade stock, options and futures
Lightspeed offers active and professional traders highly accurate market data, complex order management, fast executions, and multiple routing destinations.
Lightspeed Financial Services Group LLC is not affiliated with these third-party market commentators/educators or service providers. Data, information, and material (“Content”) are provided for informational and educational purposes only. This content neither is, nor should be construed as an offer, solicitation, or recommendation to buy or sell any securities or contracts. Any investment decisions made by the user through the use of such content are solely based on the user's independent analysis taking into consideration your financial circumstances, investment objectives, and risk tolerance. Lightspeed Financial Services Group LLC does not endorse, offer or recommend any of the services or commentary provided by any of the market commentators/educators or service providers, and any information used to execute any trading strategies are solely based on the independent analysis of the user.