Lightspeed guide
Charts
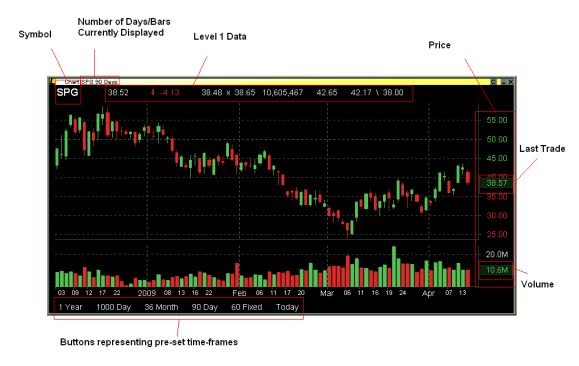
Lightspeed Trader Charts: The Lightspeed Trader Charts are described in depth in this memo. Users will find the charts to be easy to use, completely customizable, and more performant.

I. Changing the chart parameters
The charts allow users to create time frame “buttons.” These buttons are used to quickly switch between pre-defined time frames and chart settings and are displayed at the bottom of your chart window.
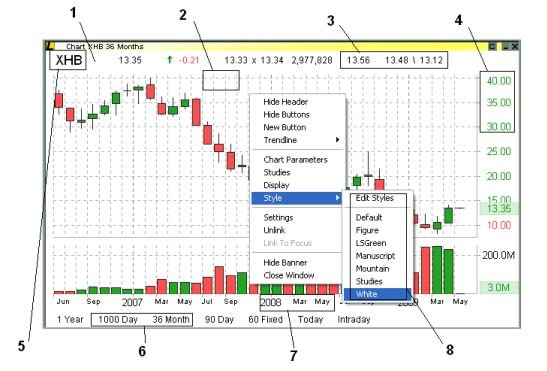
There are several ways to change the Chart Parameters you are looking at: 1) Buttons at the bottom of the chart, 2) Right-Clicking and Selecting Chart Parameters, 3) Using your mouse wheel to Scroll backward/forward through time.
1) Selecting chart parameters
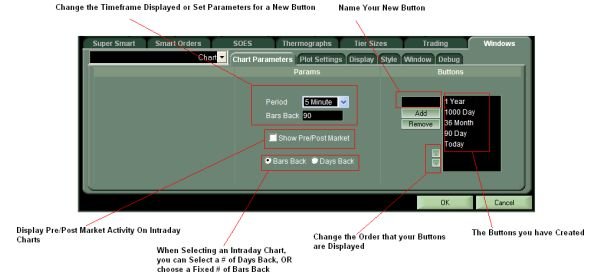
Select from Daily, Weekly, Monthly Periods and enter your # of Days, Weeks, Months back. If you select an Intraday period, you may choose from a # of Days Back, or for a Fixed bar size, select a # of Bars Back.
2) Using and editing the buttons
You may use the predefined Timeframe Buttons to change the Displayed Timeframe or you may create your own buttons with Timeframes. To create your own button, select the parameters in the above window, name it, then click Add.
Note: Users can also map the keyboard keys “Chart Button Next” and “Chart Button Previous” from the Non-Trading Function keys on the Keyboard Tab to cycle through their pre-defined Chart Parameters.
3) Zooming/Changing Timeframes with your Mouse wheel When using your mouse to change time frames, it will scroll back in the period you are currently viewing. For instance, if you are looking at a Daily Chart the mouse wheel will scroll back Days, and if you are looking at a Weekly chart you will scroll back in weeks. When viewing an Intraday Chart you can scroll back in Bars if you have selected to view a # of Bars back or you will scroll back in Days back respectively.
Note: If you want to modify an existing button you must first select the button, then modify the parameters, and then select Add again. Or, you must select your parameters, retype the name of the button and then select Add. Once you click on an existing button without selecting Add, your changes will be lost.
II. Chart style part 1: customizing the colors
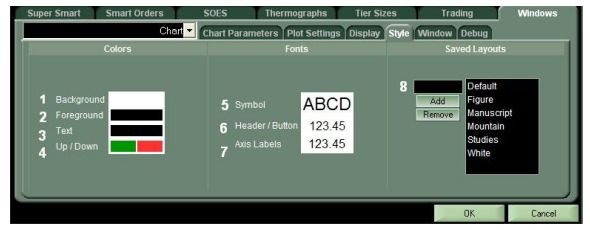
- Change the background color of the chart.
- Change the foreground color of the chart (gridlines and axis lines).
- Change the text color.
- Change the up/down text color (the colored axis, the net change, executions). Note: This does not change the color of your candles or bars, which is changed in the “Studies” Tab.
- Modify the Font of the Symbol in the top right corner of your chart.
- Modify the Font of the Level 1 information and your buttons.
- Modify the Font of your Axis Labels.
- Save your Layout as a Style. This will allow you to save different styles of charts. The “Style” includes all of the above settings (Colors and Fonts) as well as any studies you have added.
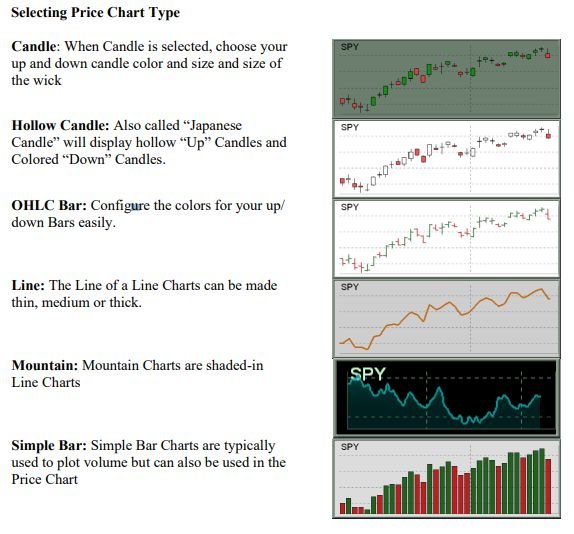
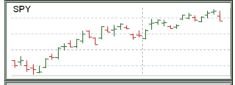
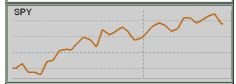
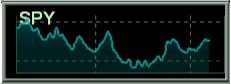
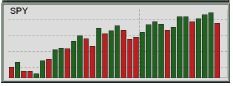
III. Chart style part 2: customizing chart type
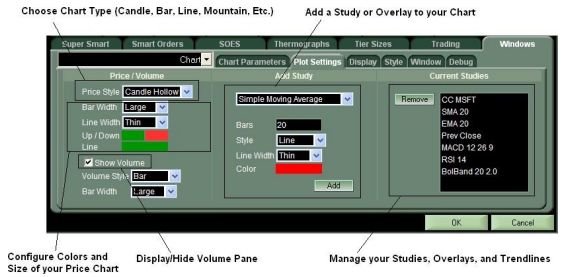
IV. Chart style part 3: adding studies
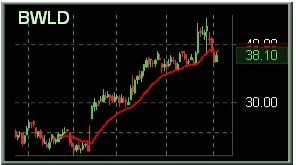
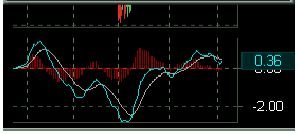
To add a Study right-click in the chart and select the Studies option, you will be taken to the Studies tab, seen above. Select from Simple Moving Average, Exponential Moving Average, Bollinger Bands, MACD, RSI, Previous Close Line, or Comparison Charts.

IV. Chart Style Part 3:
Adding Studies To add a Study right-click in the chart and select the Studies option, you will be taken to the Studies tab, seen above. Select from Simple Moving Average, Exponential Moving Average, Bollinger Bands, MACD, RSI, Previous Close Line, or Comparison Charts
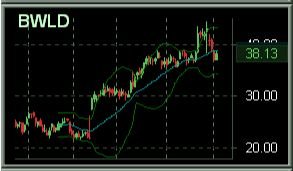
Bollinger Bands:
Consists of a middle band = X period of SMA, an upper band at N times standard deviation above, and a lower band at N times standard deviation below. Choose your # of Bars (X period, usually 20) and choose your # of standard deviations (N, usually 2). Choose your color for the middle, upper and lower bands.
V. Chart Style Part 4: Saving your Chart Style
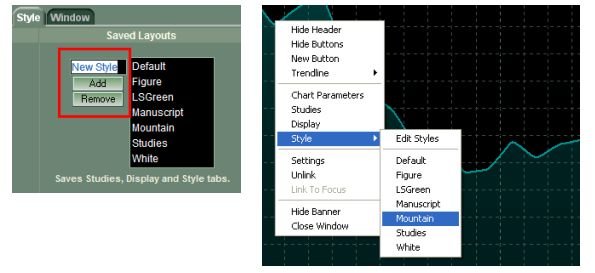
Once you have configured your chart with your desired Chart Type, Colors, Display Settings, and Studies you can save it as your own personal style. Simply name your Style [Layout] and Click Add.
Note: If you want to Modify an existing Style, you must retype the name of the style and select Add, once you click on an existing style, it will reset it and you will lose all changes.
Some Tips and Tricks for the Lightspeed Charts
- Individual Charts can be Linked in the same manner as any other windows in Lightspeed. You can link a chart to “Focus,” Unlink it for a stand-alone chart or Link a Chart to a specific Level 2 Window.
- Creating and deleting Buttons is especially easy by right-clicking on an existing button. Choices for Adding a New Button, Editing, or Deleting an existing button will come up in the right-click menu.
- By default, users must double-click within the chart window to bring up the cross-hairs. If you would like to change that to single-click, you may do so in the Display subtab.
- Users can add extra space at the end of their chart (to predict future movement) by increasing the “Extra Pixels” in the Display subtab.
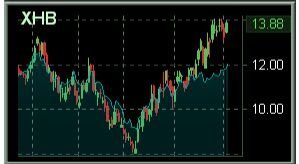
- In order to compare a price chart with another symbol, index or futures contract select “Comparison Chart” from the list of Studies in the “Studies” subtab. Lightspeed currently provides a comparison chart and an overlay. An "overlay" shows the line of the second symbol on top of your chart for best fit, while the comparison chart actually starts at the same point as your price chart, for reference.
- Users can map the keyboard keys “Chart Button Next” and “Chart Button Previous” from the Non-Trading Function keys on the Keyboard Tab to scroll through their predefined Chart Parameters.
- Hold down the Alt key to start drawing a Trendline without using the right click menu. It will default to the type of trendline you last drew (Segment, Ray, Line).
- Hold down CTRL and use your mouse wheel to move the chart along the Y-Axis. Hold Down ALT and use your mouse wheel to adjust the chart by increasing/decreasing the YAxis.
Stay up-to-date
Get the latest news and promos.